

Wyscout data for agents: which numbers to show a club
By Mariano David Pérez Co-founder

The useful Wyscout data for agents is a short list that changes with the position: four or five per-90 metrics, compared against players in the same role, with minutes played in plain sight. A bare season total — “he scored nine” — tells a sporting director nothing; the same figure set against every other striker in the league does. This guide covers what the platform offers, what to pick for each position and the mistakes that make a club stop reading.
What is Wyscout, and what kind of data does it offer?
Wyscout is a soccer video and data platform owned by Hudl, now officially branded Hudl Wyscout. According to Hudl’s product page (checked in September 2026), it brings together full matches, tagged events and statistics from more than 1,000 competitions, and is built for scouts, agents, analysts and technical directors.
The player metrics defined in its public data glossary fall into five broad families:
- Attacking: goals, non-penalty goals, shots, shots on target, xG (expected goals), touches in the box, dribbles.
- Passing and creation: pass accuracy, progressive passes, passes to the final third and to the penalty area, key passes, assists and xA (expected assists).
- Crossing: volume and accuracy, by flank and into the six-yard box.
- Defending: defensive and aerial duels with the percentage won, interceptions, recoveries, clearances, losses.
- Goalkeeping: shots against, saves, goals conceded against expected conceded goals (xCG) and exits.
Most come in two versions: the total and the ”/ 90” value, which the glossary defines as the figure normalised per 90 minutes. Some defensive metrics also have a possession-adjusted version (PAdj), which corrects for how long the opponent had the ball.
That is dozens of columns. An agent’s job is not to show them all, but to choose the ones that answer the club’s question.
Which Wyscout metrics should you show for each position?
A club looking for a full-back does not want to read about your player’s headed goals; it wants to know whether he does what a full-back does. The selection below is a sensible starting point using metric names from the Wyscout glossary. It is not an official list or the only possible one, and it should be adapted to the profile the club is actually after.
| Position | Metrics that tend to matter | The question they answer |
|---|---|---|
| Forward | Non-penalty goals / 90, xG / 90, shots on target %, touches in box / 90, aerial duels won % | Does he get into scoring positions and finish them? |
| Midfielder | Progressive passes / 90, passes to final third / 90, pass accuracy, xA / 90, recoveries / 90 | Does he move the team forward and win the ball back? |
| Defender | Defensive duels won %, aerial duels won %, interceptions (PAdj), progressive passes / 90, own half losses / 90 | Does he win his duel and play out without giving the ball away? |
| Goalkeeper | Goals conceded against xCG, saves, exits / 90, passes and average pass length | Does he save more than expected, and how is he with his feet? |
Two notes on the table:
- The real position, not the registered one. A winger playing as a wing-back must be compared with wing-backs. Against wingers, his attacking numbers will look poor and his defensive ones extraordinary; neither is true.
- Goalkeepers are the hardest position to present with data. The most honest metric is the gap between the goals he conceded and those he “should” have conceded given the quality of the shots (in Wyscout, conceded goals minus xCG). A save percentage on its own depends too heavily on how well the team in front of him defends.
Why use per-90 values and percentiles instead of season totals?
Totals reward whoever played the most, not whoever played best. An example with invented figures: Daniel Okafor, a 21-year-old forward, scored 6 goals in 1,080 minutes; his team-mate scored 9 in 2,700. On totals the team-mate wins. Per 90 minutes, Okafor scores 0.50 and his team-mate 0.30. The per-90 figure tells the story the total hides.
But per 90 is not enough on its own, for two reasons:
- It does not say whether the number is high or low. Is 0.50 goals per 90 good? For a centre-forward in that league it may be excellent; to know, you have to place it against everyone who plays that role. That is a percentile: “88th percentile” means he outperforms 88% of the players in his position on that metric. It is the fastest way for a sporting director to understand a number without knowing the league.
- On few minutes, it misleads. A player with 200 minutes and two goals has 0.90 per 90 — a superstar figure that means nothing. There is no official threshold; many people in the trade ignore per-90 values below roughly 600 to 900 minutes. The practical rule: always show the minutes next to the figure, and if they are low, say so yourself before the club notices.
Percentiles come with one condition: the comparison group has to be honest. Same position, same competition or competitions of a similar level, and a minimum number of minutes for everyone. A 95th percentile against “every player in the database” is worth nothing.
What mistakes should you avoid when using data to present a player?
- Cherry-picking only the flattering metrics. The club has its own access to data and will look at the rest. If your centre-back loses a lot of aerial duels, it is better to say so and explain the context than to let them find out.
- Treating different leagues as equal. Eight progressive passes per 90 in a second tier are not the same as eight in a top-five league. Stating who the player was compared against is part of the number.
- Ignoring team style. A centre-back in a side that defends for ninety minutes will rack up more clearances and interceptions than one in a dominant side. That is what possession-adjusted metrics are for; if you do not use them, at least mention the context.
- Sending the whole spreadsheet. Forty columns with no hierarchy do not get read. Four or five chosen metrics, with percentile, minutes and season, fit on one page and take a minute to read.
- Believing data replaces video and a report. Data opens the door; the decision is made by watching the player. What works best is data alongside clips and a report from someone who has seen him play.
There is a sixth, more about form than substance: not saying where the number came from or which season it covers. A figure with no source and no date breeds distrust, even when it is right.
How Wyscout data gets into The Scout Arena
First, what it is not: The Scout Arena is not affiliated with Wyscout or Hudl, does not connect to your account and does no scraping. Wyscout is a trademark of its owner, and we name it only to describe how many agencies work.
What it does do: if you already have your own Wyscout account, you export the data from there and upload that file to the panel. The export lands in each player’s profile, matched by name, team and age; anything that does not match cleanly is left for manual review and is never assigned automatically. Every block of statistics states which source its numbers came from, so the data from your export is never blended with anything else.
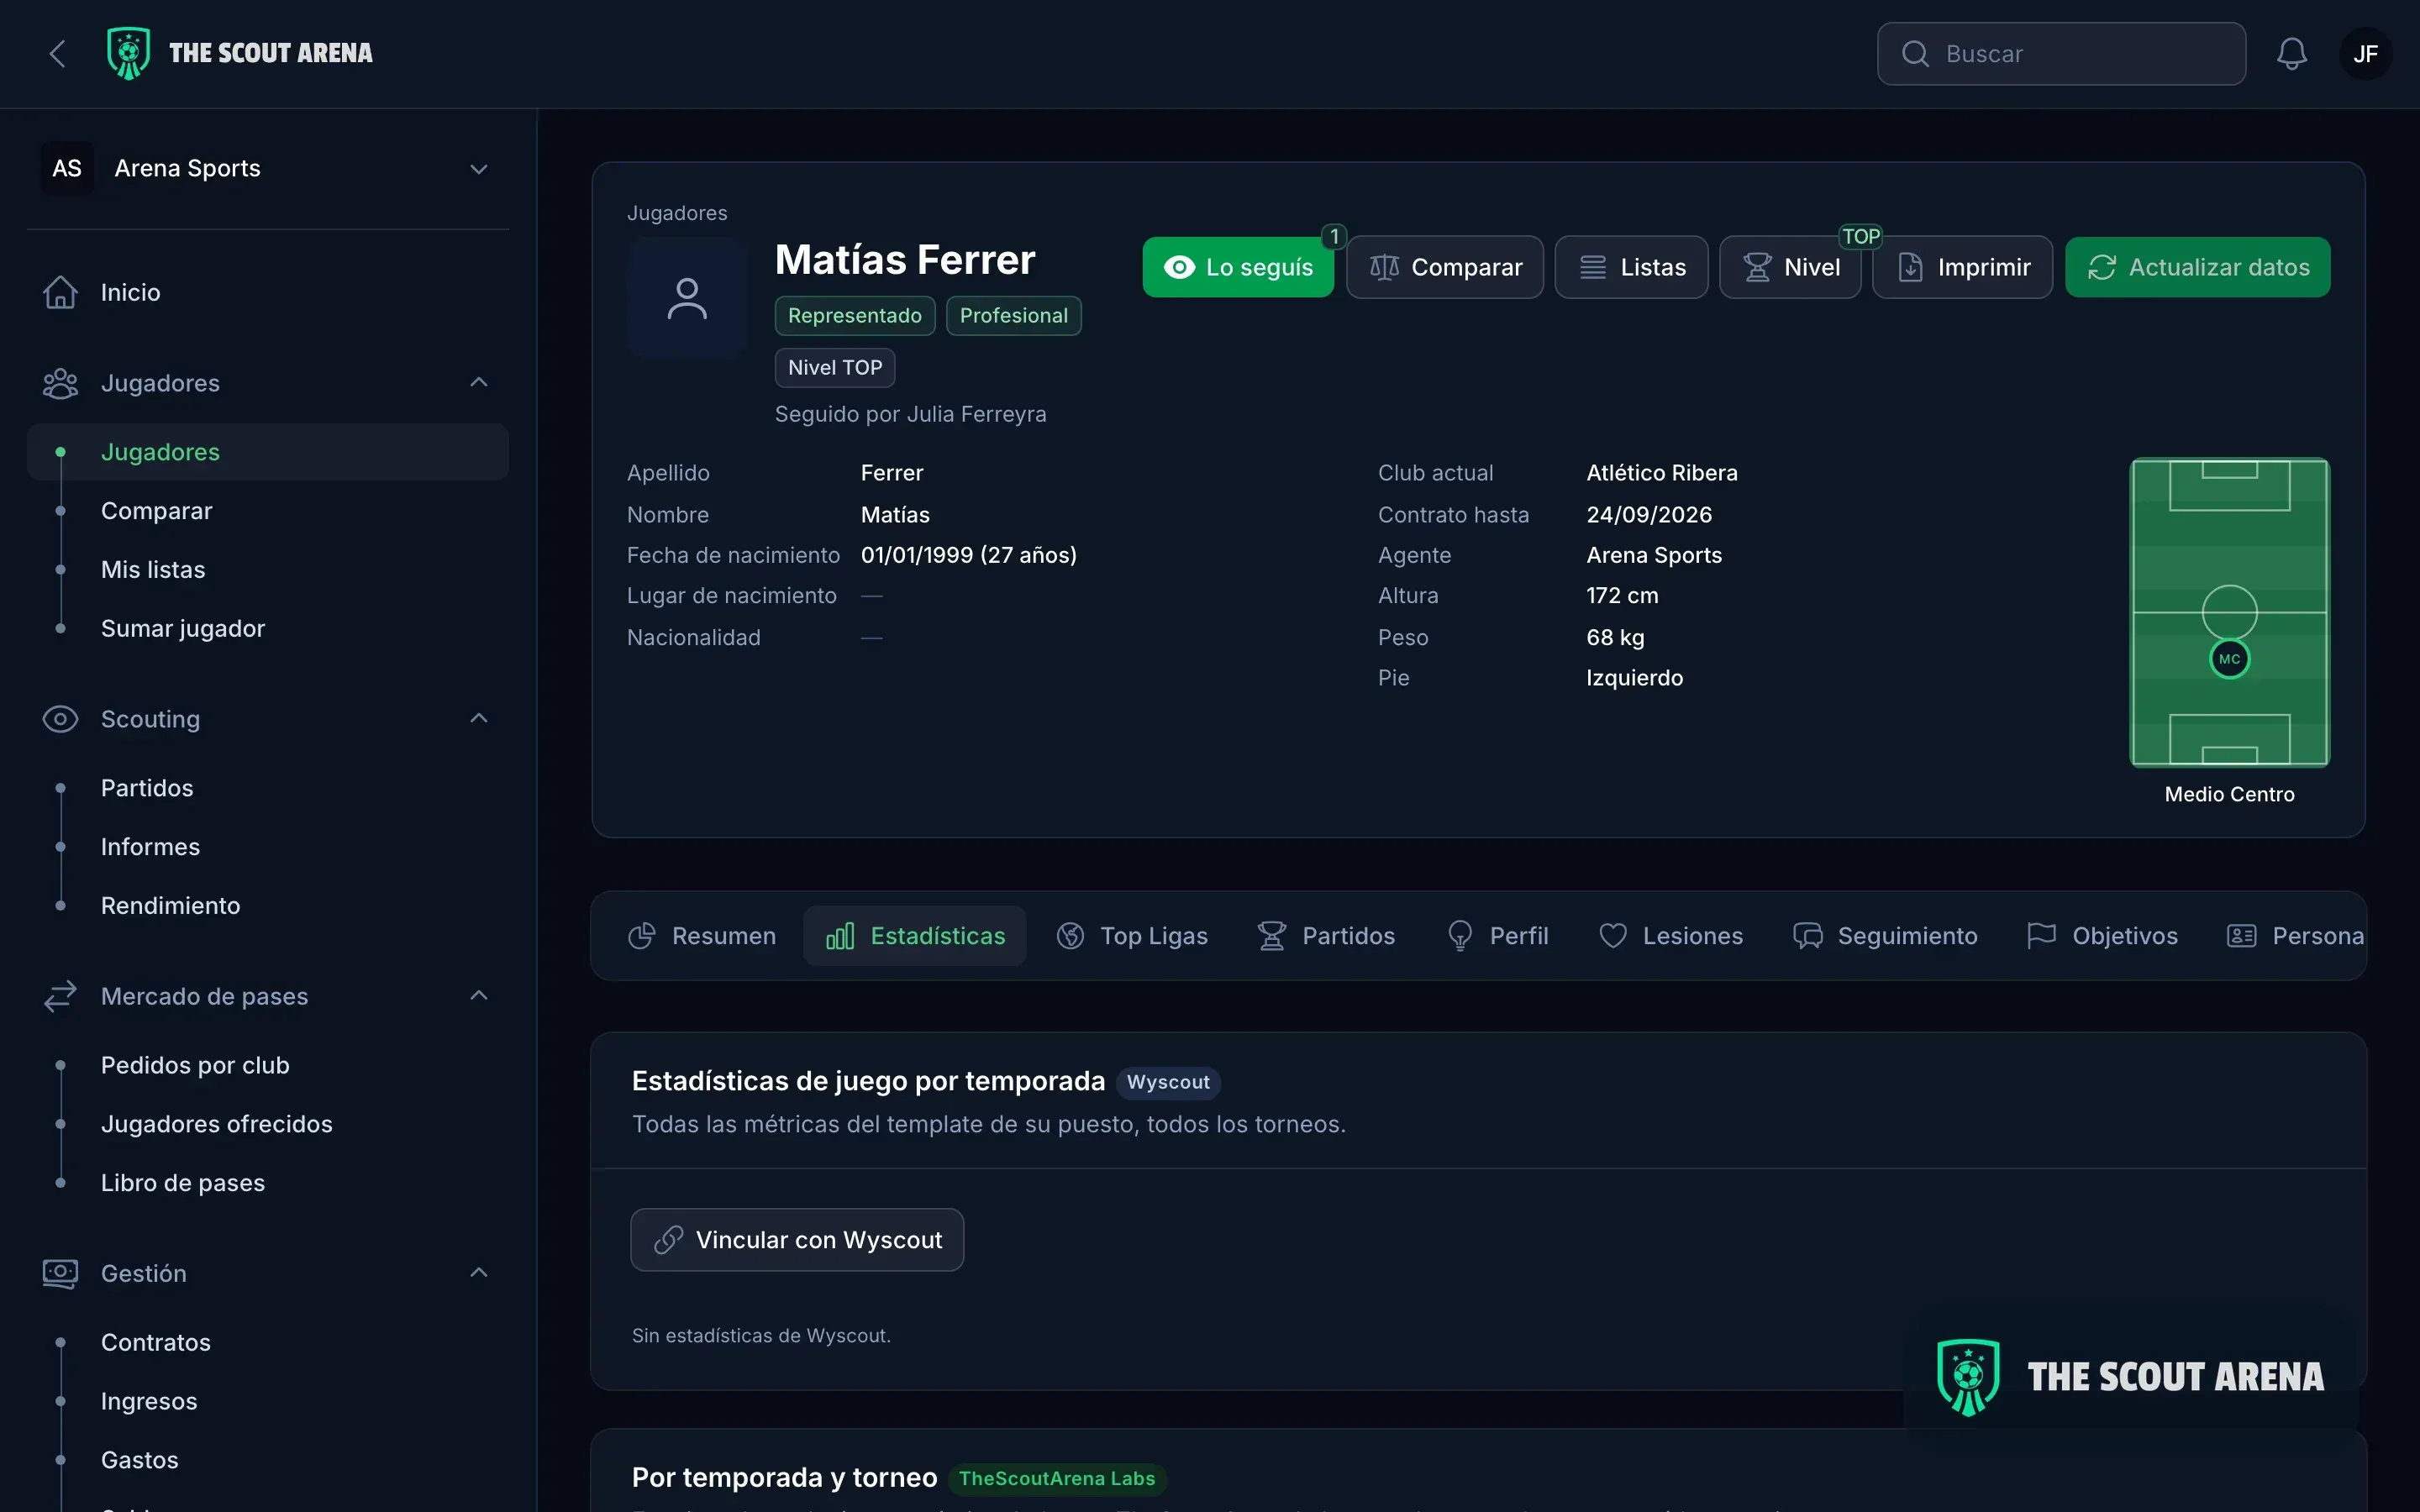
Alongside that sits The Scout Arena Labs, our method for gathering data on leagues, matches and season statistics and showing every number against the average for the position — the very reading this article argues for. It all ends up in the player profile, together with contracts, follow-up notes and reports, which is what you later put in front of a club.
If you are still setting up your agency and have not yet reached the stage of presenting players with data, start with how to become a soccer agent.
In short
Wyscout data works for an agent when it is curated: four or five metrics specific to the position, per 90 minutes, with a percentile against players in the same role, and with minutes played and the season clearly shown. Totals, full spreadsheets and numbers without context work against you. And data never travels alone: it goes with video and with a report from someone who has watched the player.
This article is for information only and was last updated in September 2026. The Scout Arena has no commercial relationship or affiliation with Hudl or Wyscout.
Sources
The description of Wyscout and the metric names come from these pages, checked in September 2026:
- Hudl: Hudl Wyscout product page.
- Wyscout: data glossary, in particular the entries on minutes played and per-90 normalisation, possession-adjusted metrics, xG and xCG, xA and progressive passes.