

What is xG in soccer: expected goals without the math
By Mariano David Pérez Co-founder
If you are asking what is xG in soccer, the short answer is this: expected goals is the probability that a shot ends in a goal, worked out from thousands of similar shots in the past. Every shot gets a value between 0 and 1: an xG of 0.35 means a chance like that is scored 35 times in 100. Add up the xG of every shot a player or a team takes and you get how many goals they “deserved” from the chances they created, whether or not they put them away.
How is a shot’s xG worked out?
An xG model looks at where and how the shot was taken and compares it with historical shots in similar conditions. The factors almost every model uses are distance to goal, angle, the body part used (foot or head) and the type of action before the shot: a cross, a through ball, a set piece, a dribble. Opta, which introduced the metric in 2012 through Sam Green, says its current model evaluates more than twenty variables across nearly a million shots, including goalkeeper position and defensive pressure.
The Wyscout data glossary lists its own: shot location and assist location, foot or head, assist type, whether there was a dribble beforehand, whether it came from a set piece or a counter-attack, and the tagger’s assessment of how dangerous the shot was. No model looks at the player: it gives Messi and a fourth-tier youngster the same xG for the same shot. That is not a flaw, it is the point: xG measures the quality of the chance, not the quality of the finisher.
Why does the same shot get a different xG depending on who measures it?
Because there is no single xG: there is one model per provider, and each uses different factors. Hudl Statsbomb explains that its model adds the goalkeeper’s position, the position of every attacker and defender in frame and the height of impact, and gives the example: a shot a basic model values at 0.30 can be worth 0.65 once you know the goalkeeper was out of position.
The practical consequence: a player’s xG in Wyscout cannot be compared with another player’s xG in Opta. When you compare two players, make sure the number comes from the same source.
How do you read a player’s or a team’s xG?
Against actual goals, and over a long period. If a striker has 12 goals from 8.5 xG, he scored more than his chances were worth; 6 goals from 9 xG, less. The Premier League published its figures for the 2022/23 season: Arsenal scored 88 goals from an xG of 73.33, and Harry Kane 30 from 21.46. Both converted well above expectation.
What that gap means depends on the sample size. Over three matches it means nothing: it is noise. Over a full season it starts to say something about the player’s finishing, or his luck. Opta spells it out: goals are not “expected” to happen exactly as the probability predicts; as with a coin toss, results get closer to xG the larger the sample, and a player can sustain overperformance without anything forcing him to “regress” to the average.
Two readings worth keeping to hand:
| Reading | What it says | What it is for |
|---|---|---|
| xG per 90 minutes | How many goals he “deserves” per full match | Comparing players with different minutes |
| Goals minus xG | Whether he converts more or less than his chances are worth | With a season or more, separating finishing from luck |
If the provider publishes non-penalty xG, use that one to compare: a penalty is worth a lot and says nothing about how the player gets into shooting positions in open play. How per-90 normalisation works and why it matters is in which Wyscout data is useful to an agent.
What does xG tell a scout, and what does it not?
It tells you whether a player gets into goalscoring positions, and how good they are. A number nine with a high xG per 90 gets where he needs to be, whether or not he scores this season; one with many shots and low xG is shooting from distance or from poor angles. For a striker, that is almost the first thing you want to know, which is why FIFA included it among the eleven metrics of its Enhanced Soccer Intelligence from the 2022 World Cup onwards.
What it does not tell you:
- How he finishes. That is what goals against xG are for, with a large sample, and the video.
- What happens before the shot. The run, the decision to shoot or pass, the first touch. xG starts when the ball leaves the foot.
- Anything about a defender or a holding midfielder. They rarely shoot; their xG is almost always low and means nothing.
- What the goalkeeper did. That is what post-shot xG is for, which Wyscout calls xCG: it measures only shots on target and where they were heading, and is used to judge how much a goalkeeper saved above expectation.
xG is a better question, not an answer. If a youngster has a high xG and few goals, go and watch him: it may be a bad run or finishing that is not improving. How to write down what you saw is in our guide to the soccer scouting report.
How xG fits into a player profile in The Scout Arena
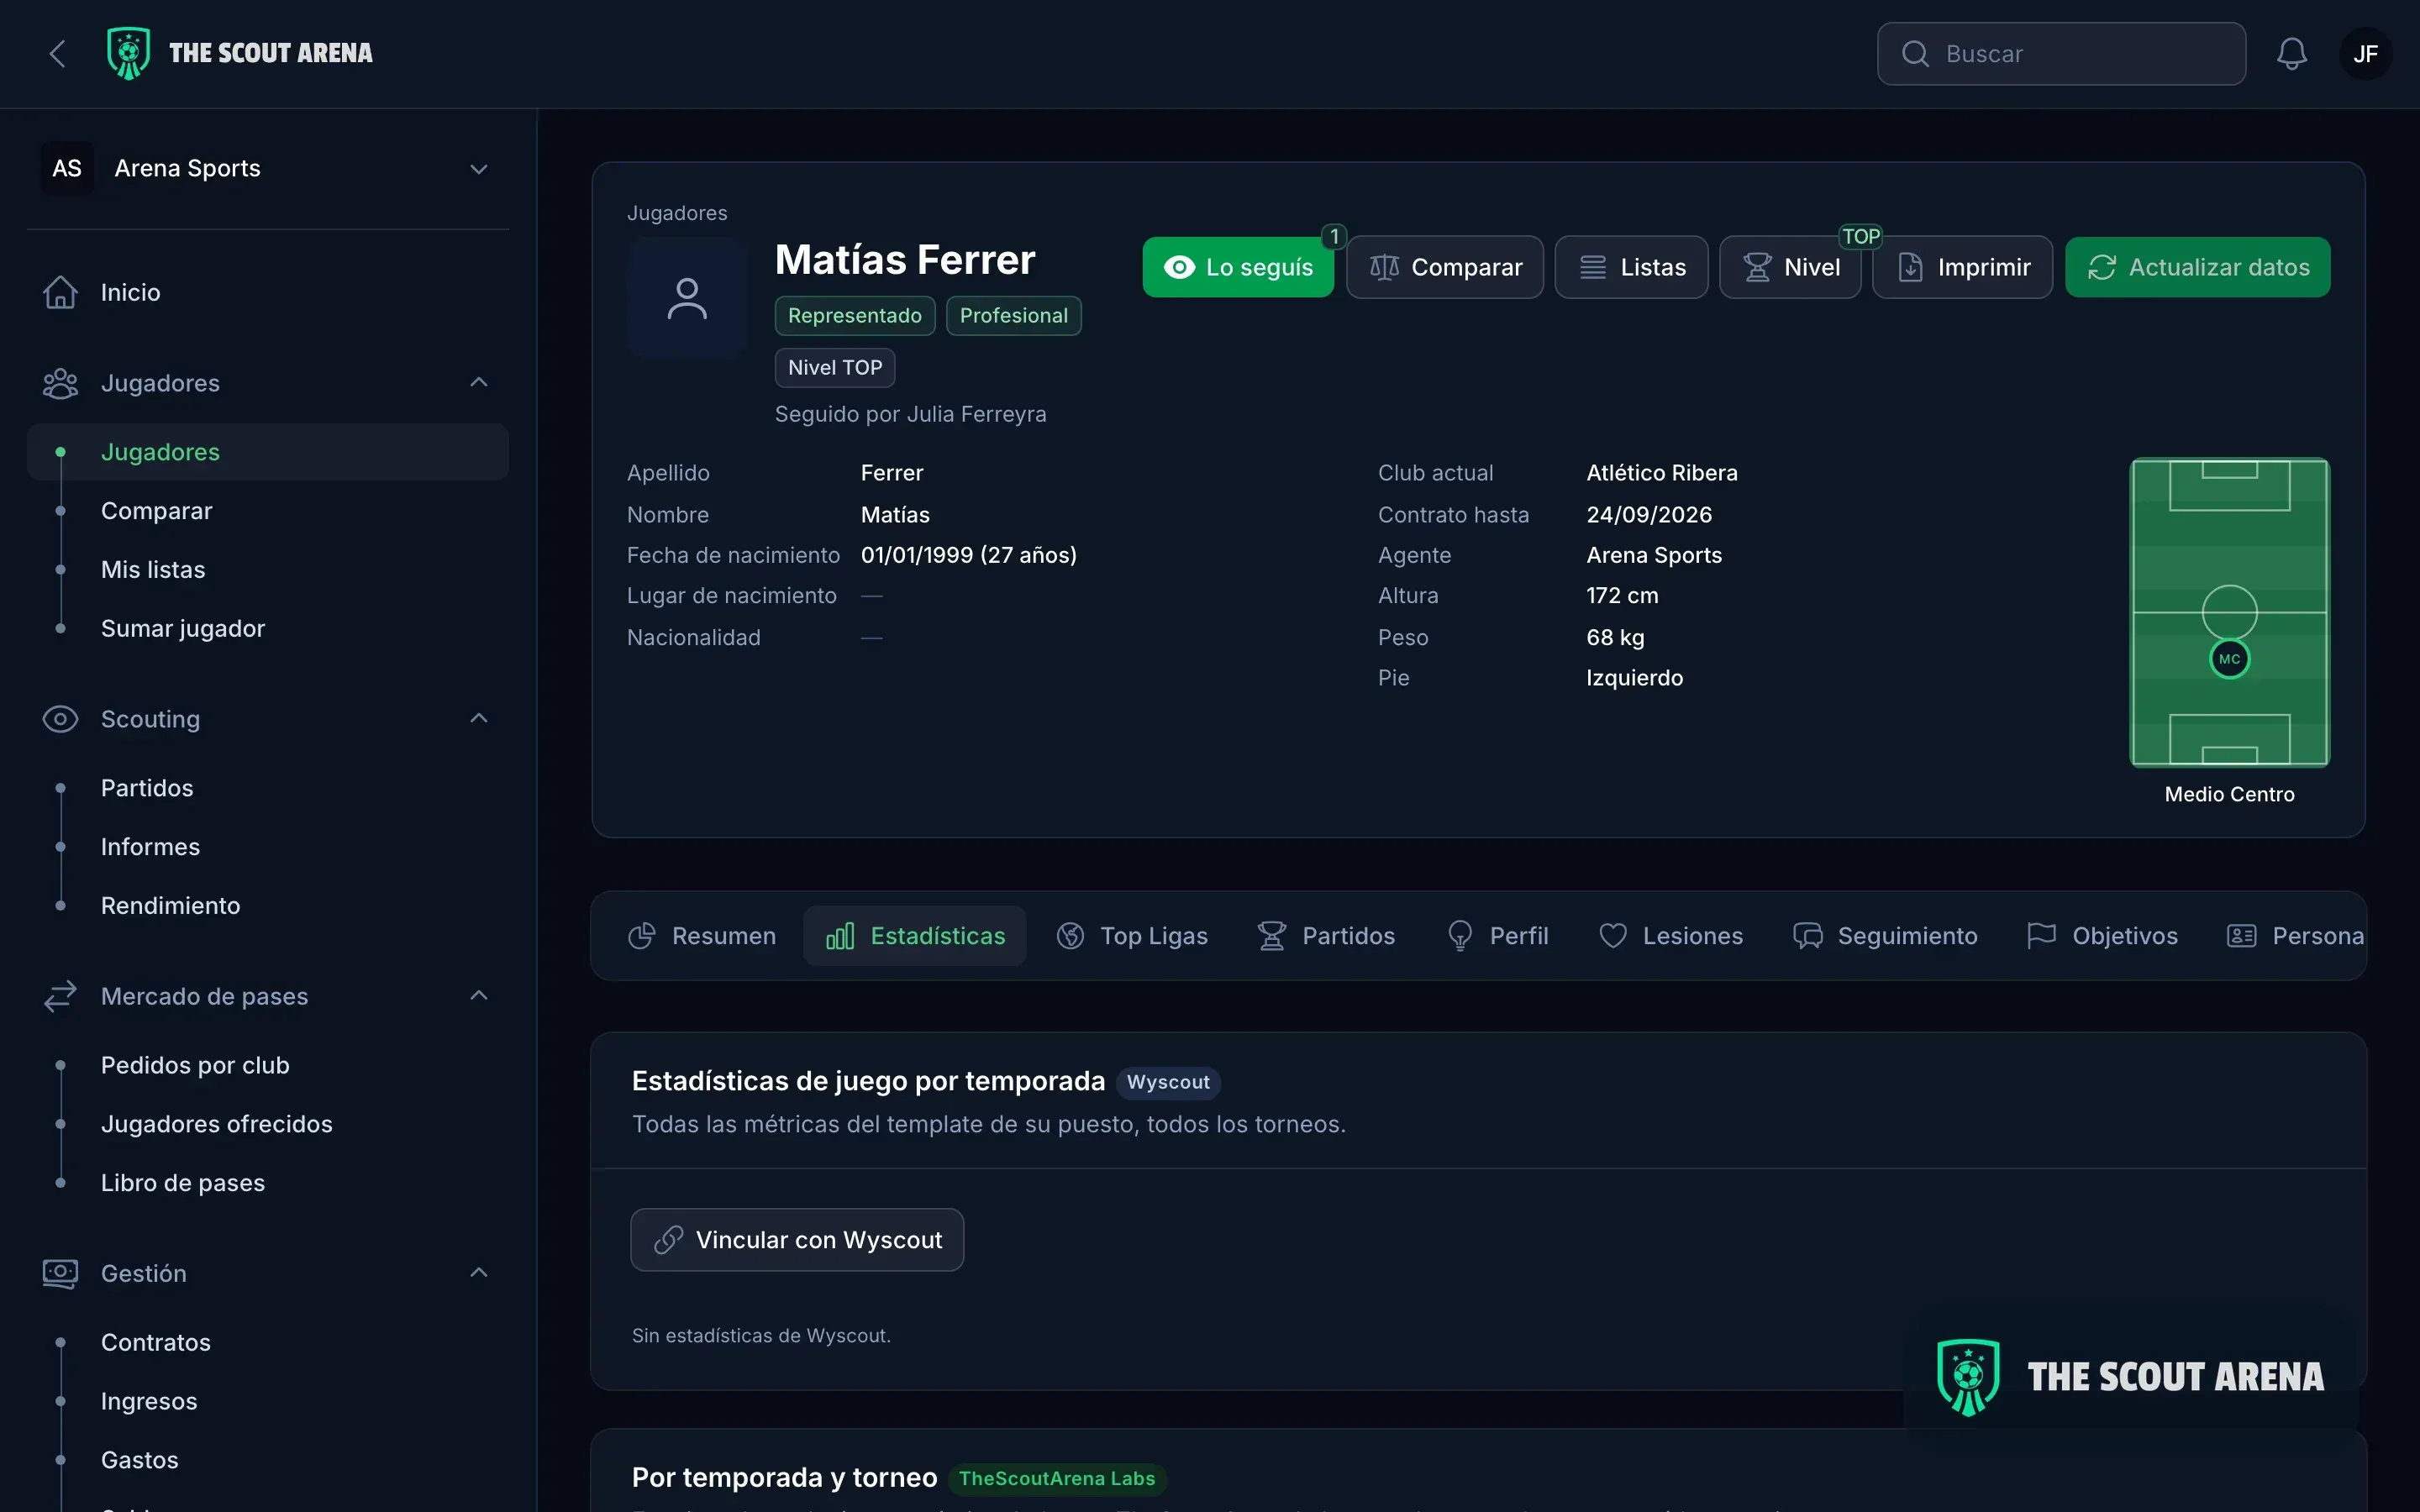
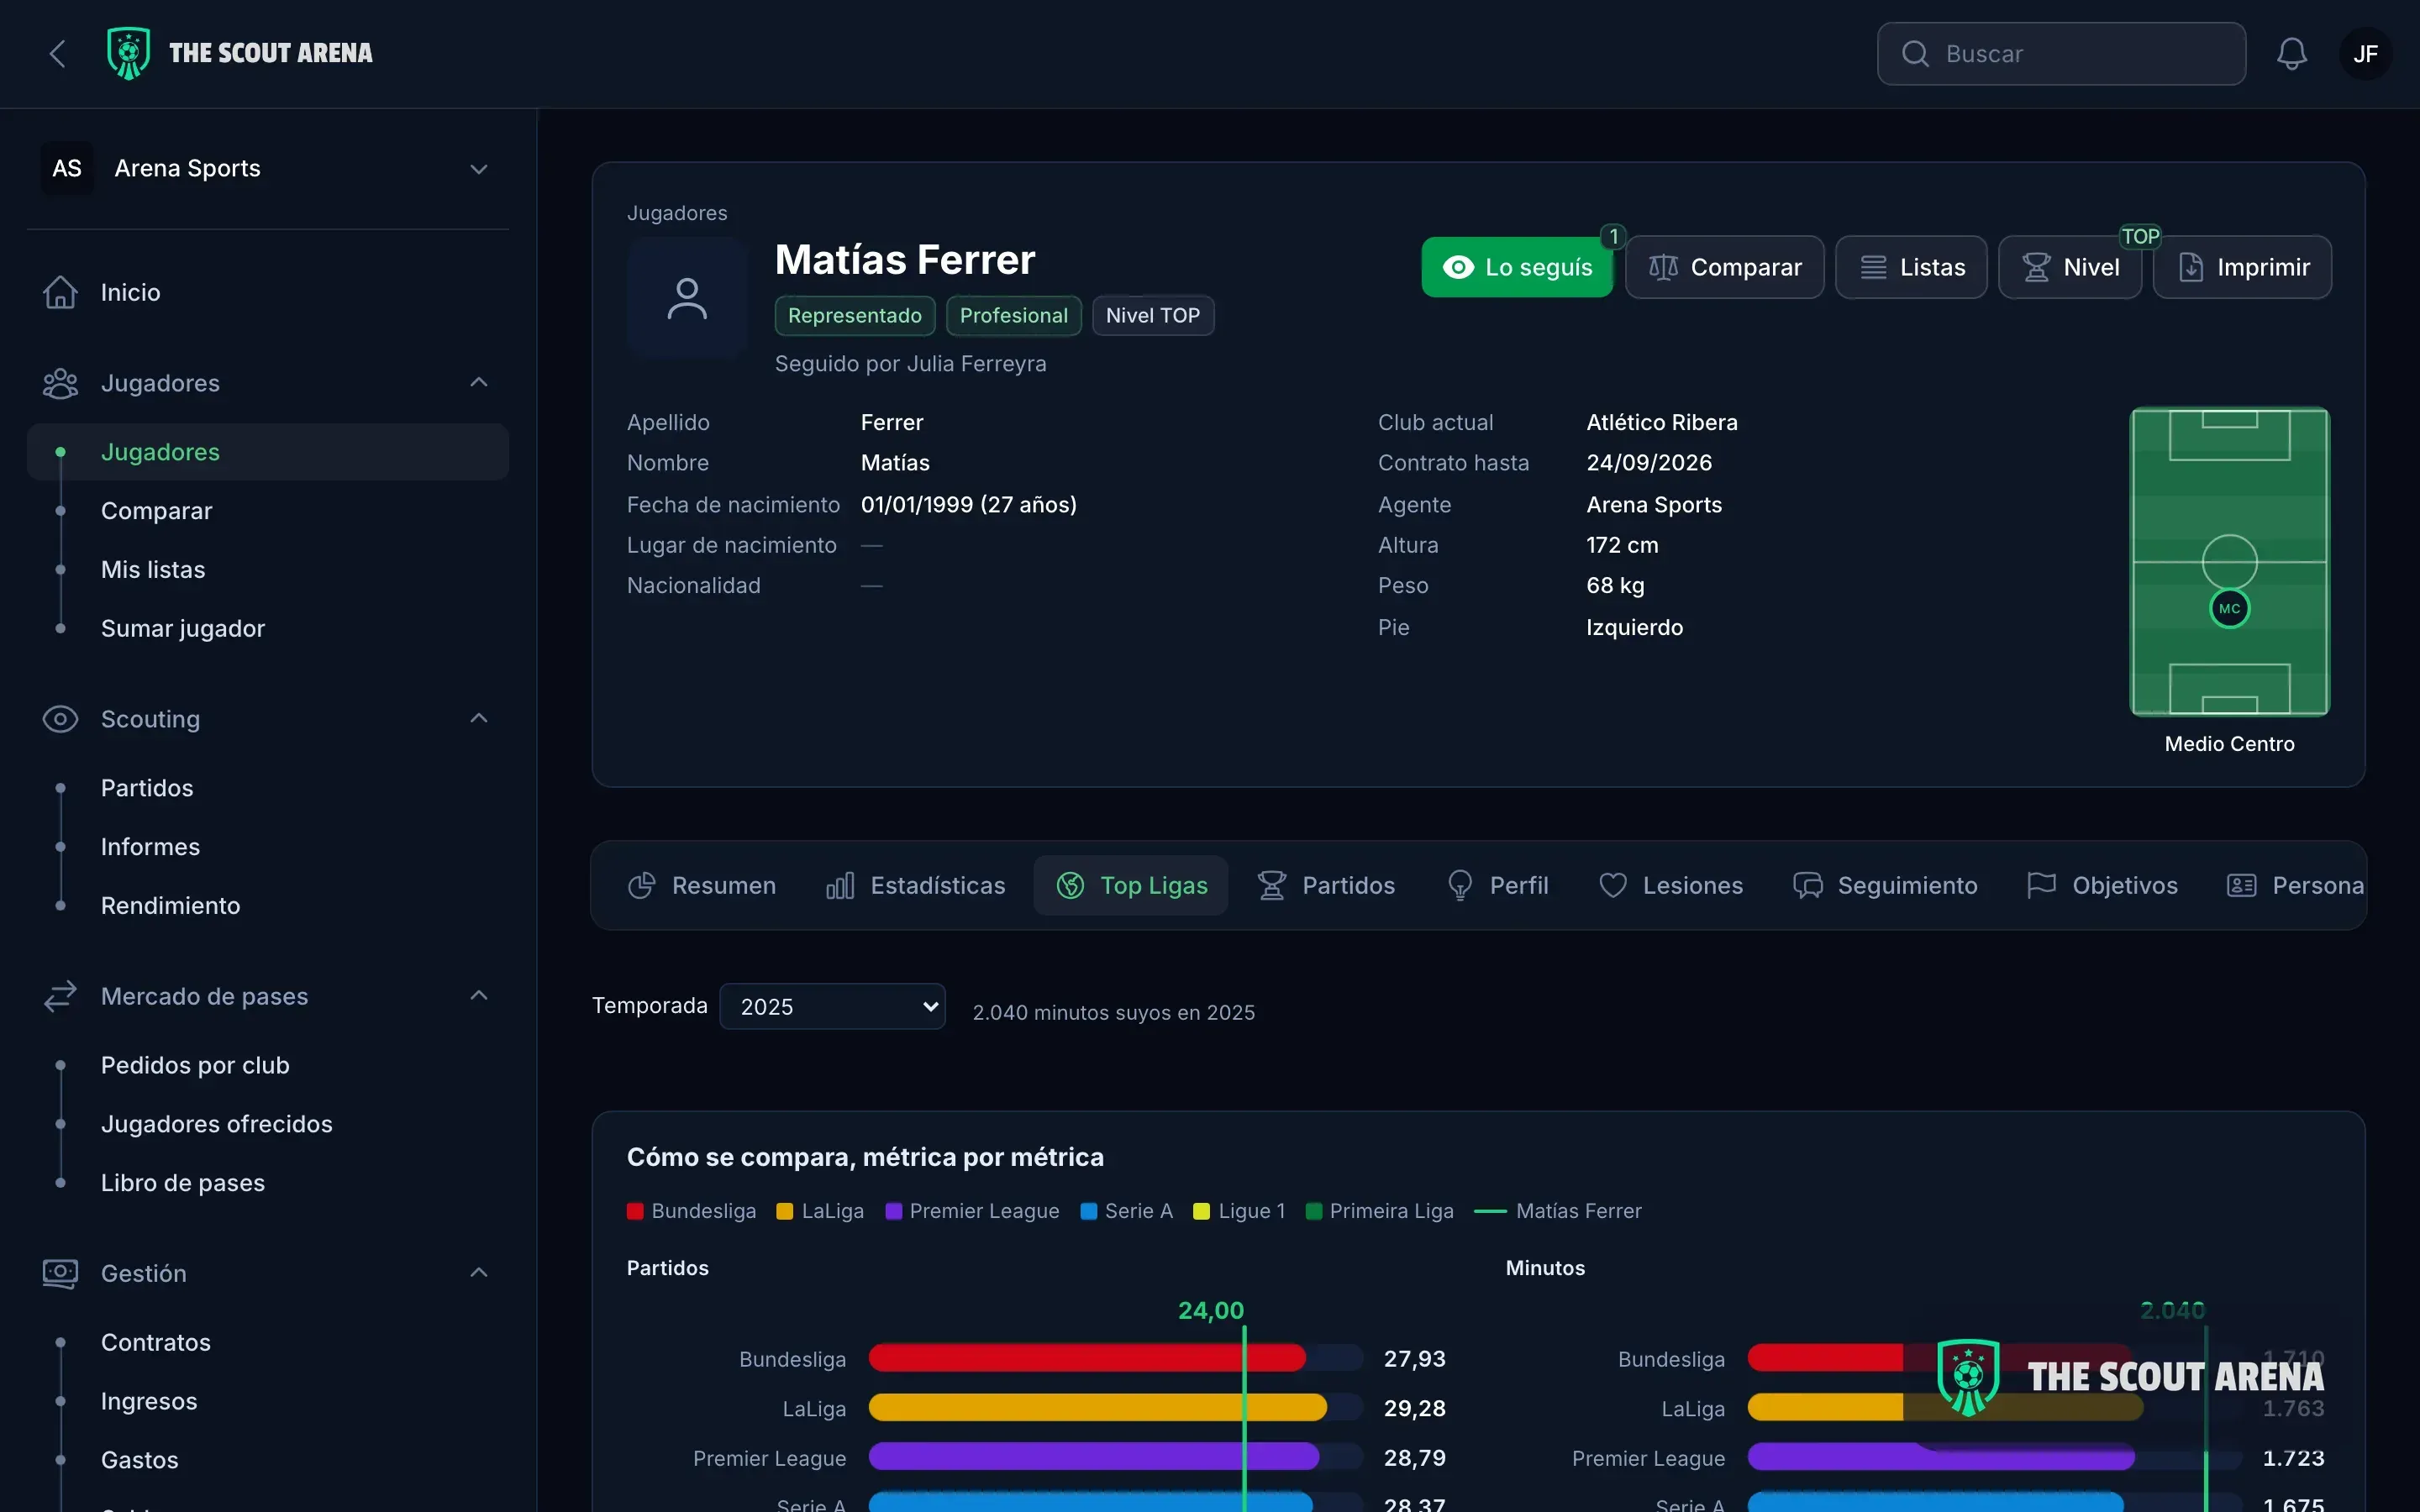
In The Scout Arena, xG is not a loose number in a spreadsheet: it lives on the player profile, next to his matches, his statistics by season and the reports your scouts wrote. If you work with Wyscout, you upload your export and it lands in the same place, matched by name, team and age, with every block saying which source it came from. And every one of the player’s numbers is compared with the average for his position in the world’s top six leagues, which is the comparison a club understands.
What that looks like over a working week is on our page for soccer scouts.
In short
xG is the probability of a goal for each shot, based on thousands of similar shots, and added up it says how many goals a player’s or a team’s chances were worth. Every provider calculates it with its own model, so compare within one source. Read it against actual goals, with a season or more of sample, and preferably without penalties. It tells a scout whether a player gets into goalscoring positions; how he finishes them, what he does before the shot and what a defender does, it does not.
Updated October 2026.
Sources
Checked in October 2026:
- Opta, The Analyst: What is expected goals (xG)?.
- Wyscout data glossary: xG and xCG.
- Hudl Statsbomb: Expected goals (xG) explained.
- Premier League: 2022/23 in numbers: who did best for expected goals?, 21 June 2023.
- FIFA Training Centre: FIFA to introduce Enhanced Soccer Intelligence at FIFA World Cup 2022, 11 November 2022.