

Football metrics by position: what to look at for each role
By Mariano David Pérez Co-founder
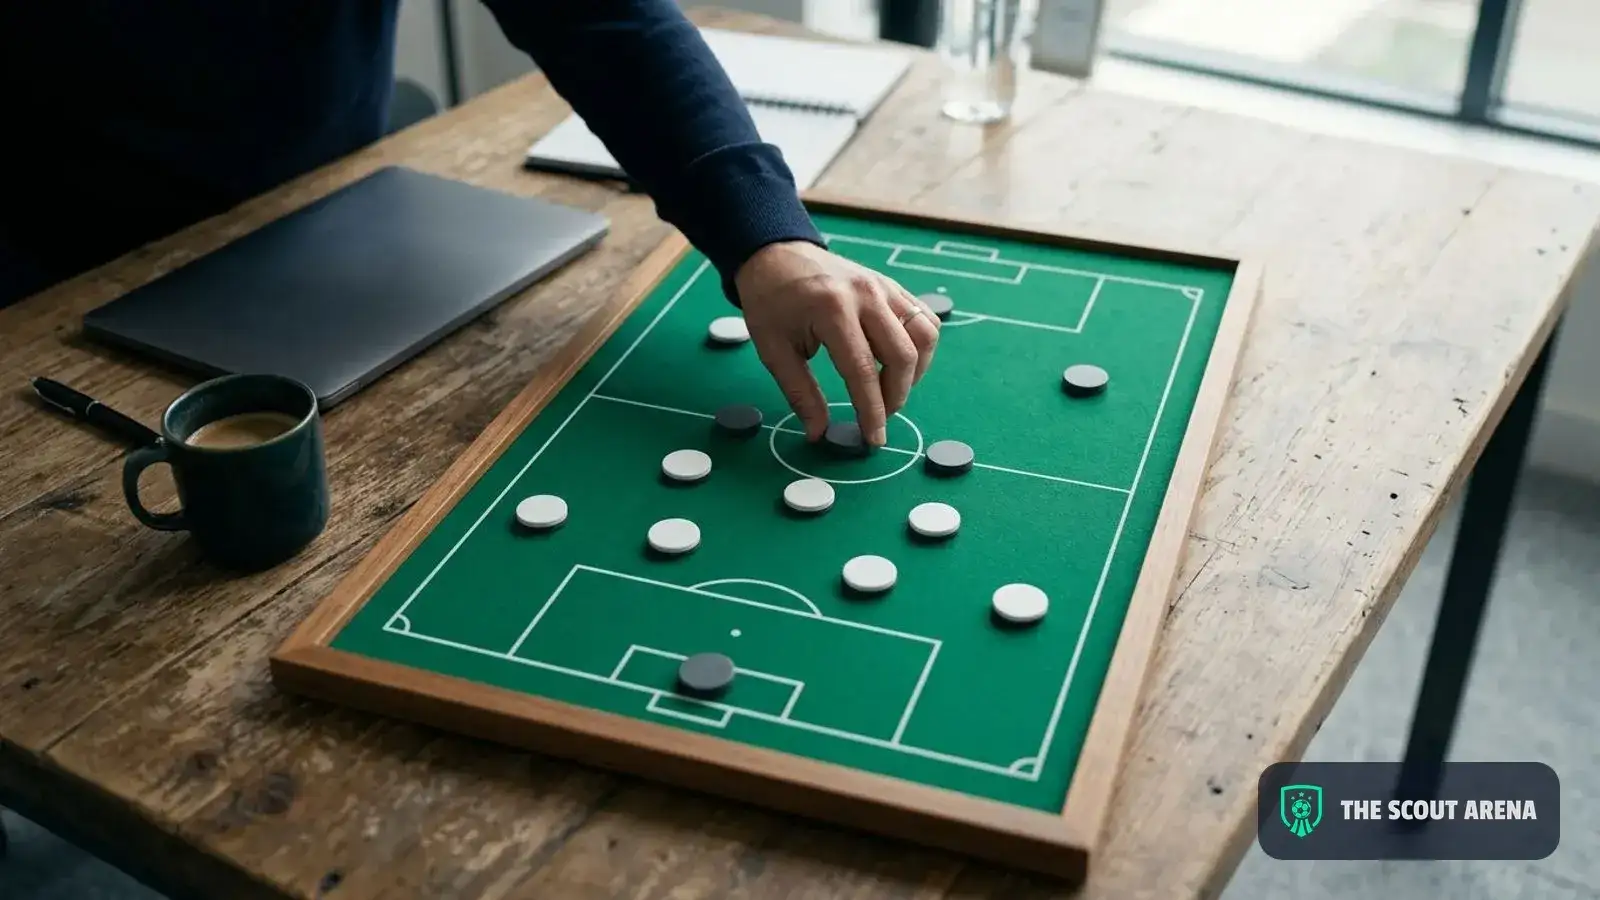
Football metrics by position are the handful of numbers that answer what each role is asked to do: for a goalkeeper, how much he saves above expectation and how he plays with his feet; for a centre-back, whether he wins his duels and plays out cleanly; for a full-back, how far he moves the team forward without leaving his flank open; for a midfielder, whether he progresses the ball and wins it back; for a winger, whether he creates danger; for a striker, whether he gets into scoring positions. No list is official, but data providers largely agree on what to look at, and this guide sets it out role by role.
Why do the metrics change by position?
Because the same figure means different things depending on where a player plays. Two shots a game is low for a number nine and remarkable for a centre-back; eight recoveries is routine for a holding midfielder and rare for a winger. Measure everyone with the same yardstick and the same positions win every time.
That is why providers build one template per position. Hudl Statsbomb, for example, publishes six radar templates — goalkeeper, centre-back, full-back, midfielder, attacking midfielder or winger, and striker — with seven metrics for the goalkeeper and eleven for each outfield role, no two templates alike. FIFA took the same route when it added eleven new metrics to its coverage from the 2022 World Cup, none of which existed in traditional statistics: line breaks, receptions behind the midfield and defensive lines, pressure on the ball, forced turnovers. They are attempts to measure what each role really does and what goals and assists leave out.
Which metrics matter for each position?
The table below is a starting point, built from metrics defined in providers’ public glossaries. It is not a closed list: adjust it to the role the player has in his team and to what the club looking at him needs.
| Position | What the role demands | Metrics that show it |
|---|---|---|
| Goalkeeper | Save more than expected, command the box, play with his feet | Goals conceded against expected, crosses claimed, distance of his actions off the line, long passes completed |
| Centre-back | Win his duel and play out | Defensive and aerial duels won %, possession-adjusted clearances and interceptions, progressive passes, passing under pressure |
| Full-back | Defend the flank and give depth | Adjusted tackles and interceptions, progressions into the final third, open-play xA, times dribbled past |
| Midfielder | Move the team forward and win the ball back | Progressive passes, progressions into the final third, turnovers, adjusted pressures and recoveries |
| Attacking midfielder or winger | Create danger | Non-penalty xG, xA, dribbles and carries, touches in the box, fouls won |
| Striker | Get into scoring positions | Non-penalty xG per 90, xG per shot, touches in the box, aerial duels won, pressures |
Goalkeeper
Save percentage on its own says little: it depends on the shots he faces. The most honest measure compares the goals he conceded with the goals he “should” have conceded given the quality of the shots on target. Wyscout calls this xCG, expected conceded goals, and works it out only from shots on target and where they were heading. Add what he does off his line: Hudl Statsbomb’s template includes how many crosses he claims against the average, how far from goal he acts, and what share of his long passes find a team-mate.

Centre-back
Duels come first. The Wyscout glossary defines a defensive duel as an attempt to dispossess an opponent to stop an attack progressing, and counts it as won if the defender halts the progression without fouling; an aerial duel is won by whoever touches the ball first. The percentage won matters, not the count: a centre-back with a lot of duels may simply play for a team that gets attacked a lot.
Then comes playing out: progressive passes, and how much his accuracy drops when he is pressed. A progressive pass, in Wyscout’s definition, moves the ball at least 30 metres closer to the opponent’s goal if it starts and ends in a team’s own half, 15 if it crosses halfway and 10 if it is played in the opponent’s half.
Full-back
The most mixed role: a full-back is measured as a defender and as an attacker at once. On the defensive side, tackles and interceptions and how often he is beaten one against one. Going forward, how much he takes the ball into the final third — by passing or carrying — and how much danger he creates: the xA of a pass is the xG of the shot that pass led to. A full-back with plenty of crosses and little xA is putting in crosses that lead nowhere.
Midfielder
The question has two halves: does he move the team forward, and does he win the ball back? For the first, progressive passes, progressions into the final third and turnovers. For the second, pressures, tackles and interceptions. How much each half weighs depends on the role: a holding midfielder is read mostly by the second, a number eight by the first. Comparing them without separating the role is the most common mistake with this position.
Attacking midfielder or winger
This is where attacking output takes over: non-penalty xG, xA, touches in the box and what he gains by dribbling or carrying. Fouls won say something the other numbers do not: how hard he is to stop. Read turnovers with care, because the player who tries the most loses the ball the most.
Striker
Before goals, non-penalty xG per 90 minutes: it says whether he gets into scoring positions, whether or not he is converting this season. xG per shot shows where he shoots from: high, and he gets into the box; low, and he tries his luck from range. Touches in the box, aerial duels won and pressures complete the picture and separate a penalty-box nine from one who drops deep to link play.
Which metrics describe the team’s style rather than the player’s level?
Nearly all the defensive ones. A centre-back in a team that defends all game will pile up more clearances and interceptions than one in a dominant side, without being better. Hudl Statsbomb says so plainly in its radar article: because centre-back outputs are tied to team tactical style, they have been used more for profiling style than quality.
The usual correction is possession adjustment. Wyscout calls it PAdj: a method that calculates defensive statistics — interceptions, defensive duels, sliding tackles — taking possession into account. It does not fix everything, but it avoids the crudest error.
The same applies, to a lesser degree, to pass accuracy: 92% may be a player who never takes a risk. Read it alongside progressive passes.

How do you compare a player against others in his position?
With four rules that hold for any source:
- Per 90 minutes, not totals. Totals reward whoever played the most.
- Against his real position. A winger playing as a wing-back is compared with wing-backs. The position on the team sheet is not always the one he fills on the pitch.
- With enough minutes, shown next to the number. On 200 minutes, any per-90 figure is noise.
- Within one source. Each provider defines a duel, a pressure or a progressive pass in its own way; numbers from two sources do not mix.
The next step is the percentile: where the player ranks among everyone in his position. Why that reads better than a bare number is covered in which Wyscout data is useful to an agent.
How this looks in The Scout Arena
In The Scout Arena the comparison is always within the position. The player profile sets each metric, per 90 minutes, next to the average for his position in the world’s six best leagues — LaLiga, the Premier League, Serie A, the Bundesliga, Ligue 1 and the Primeira Liga — league by league, with minutes played in view.
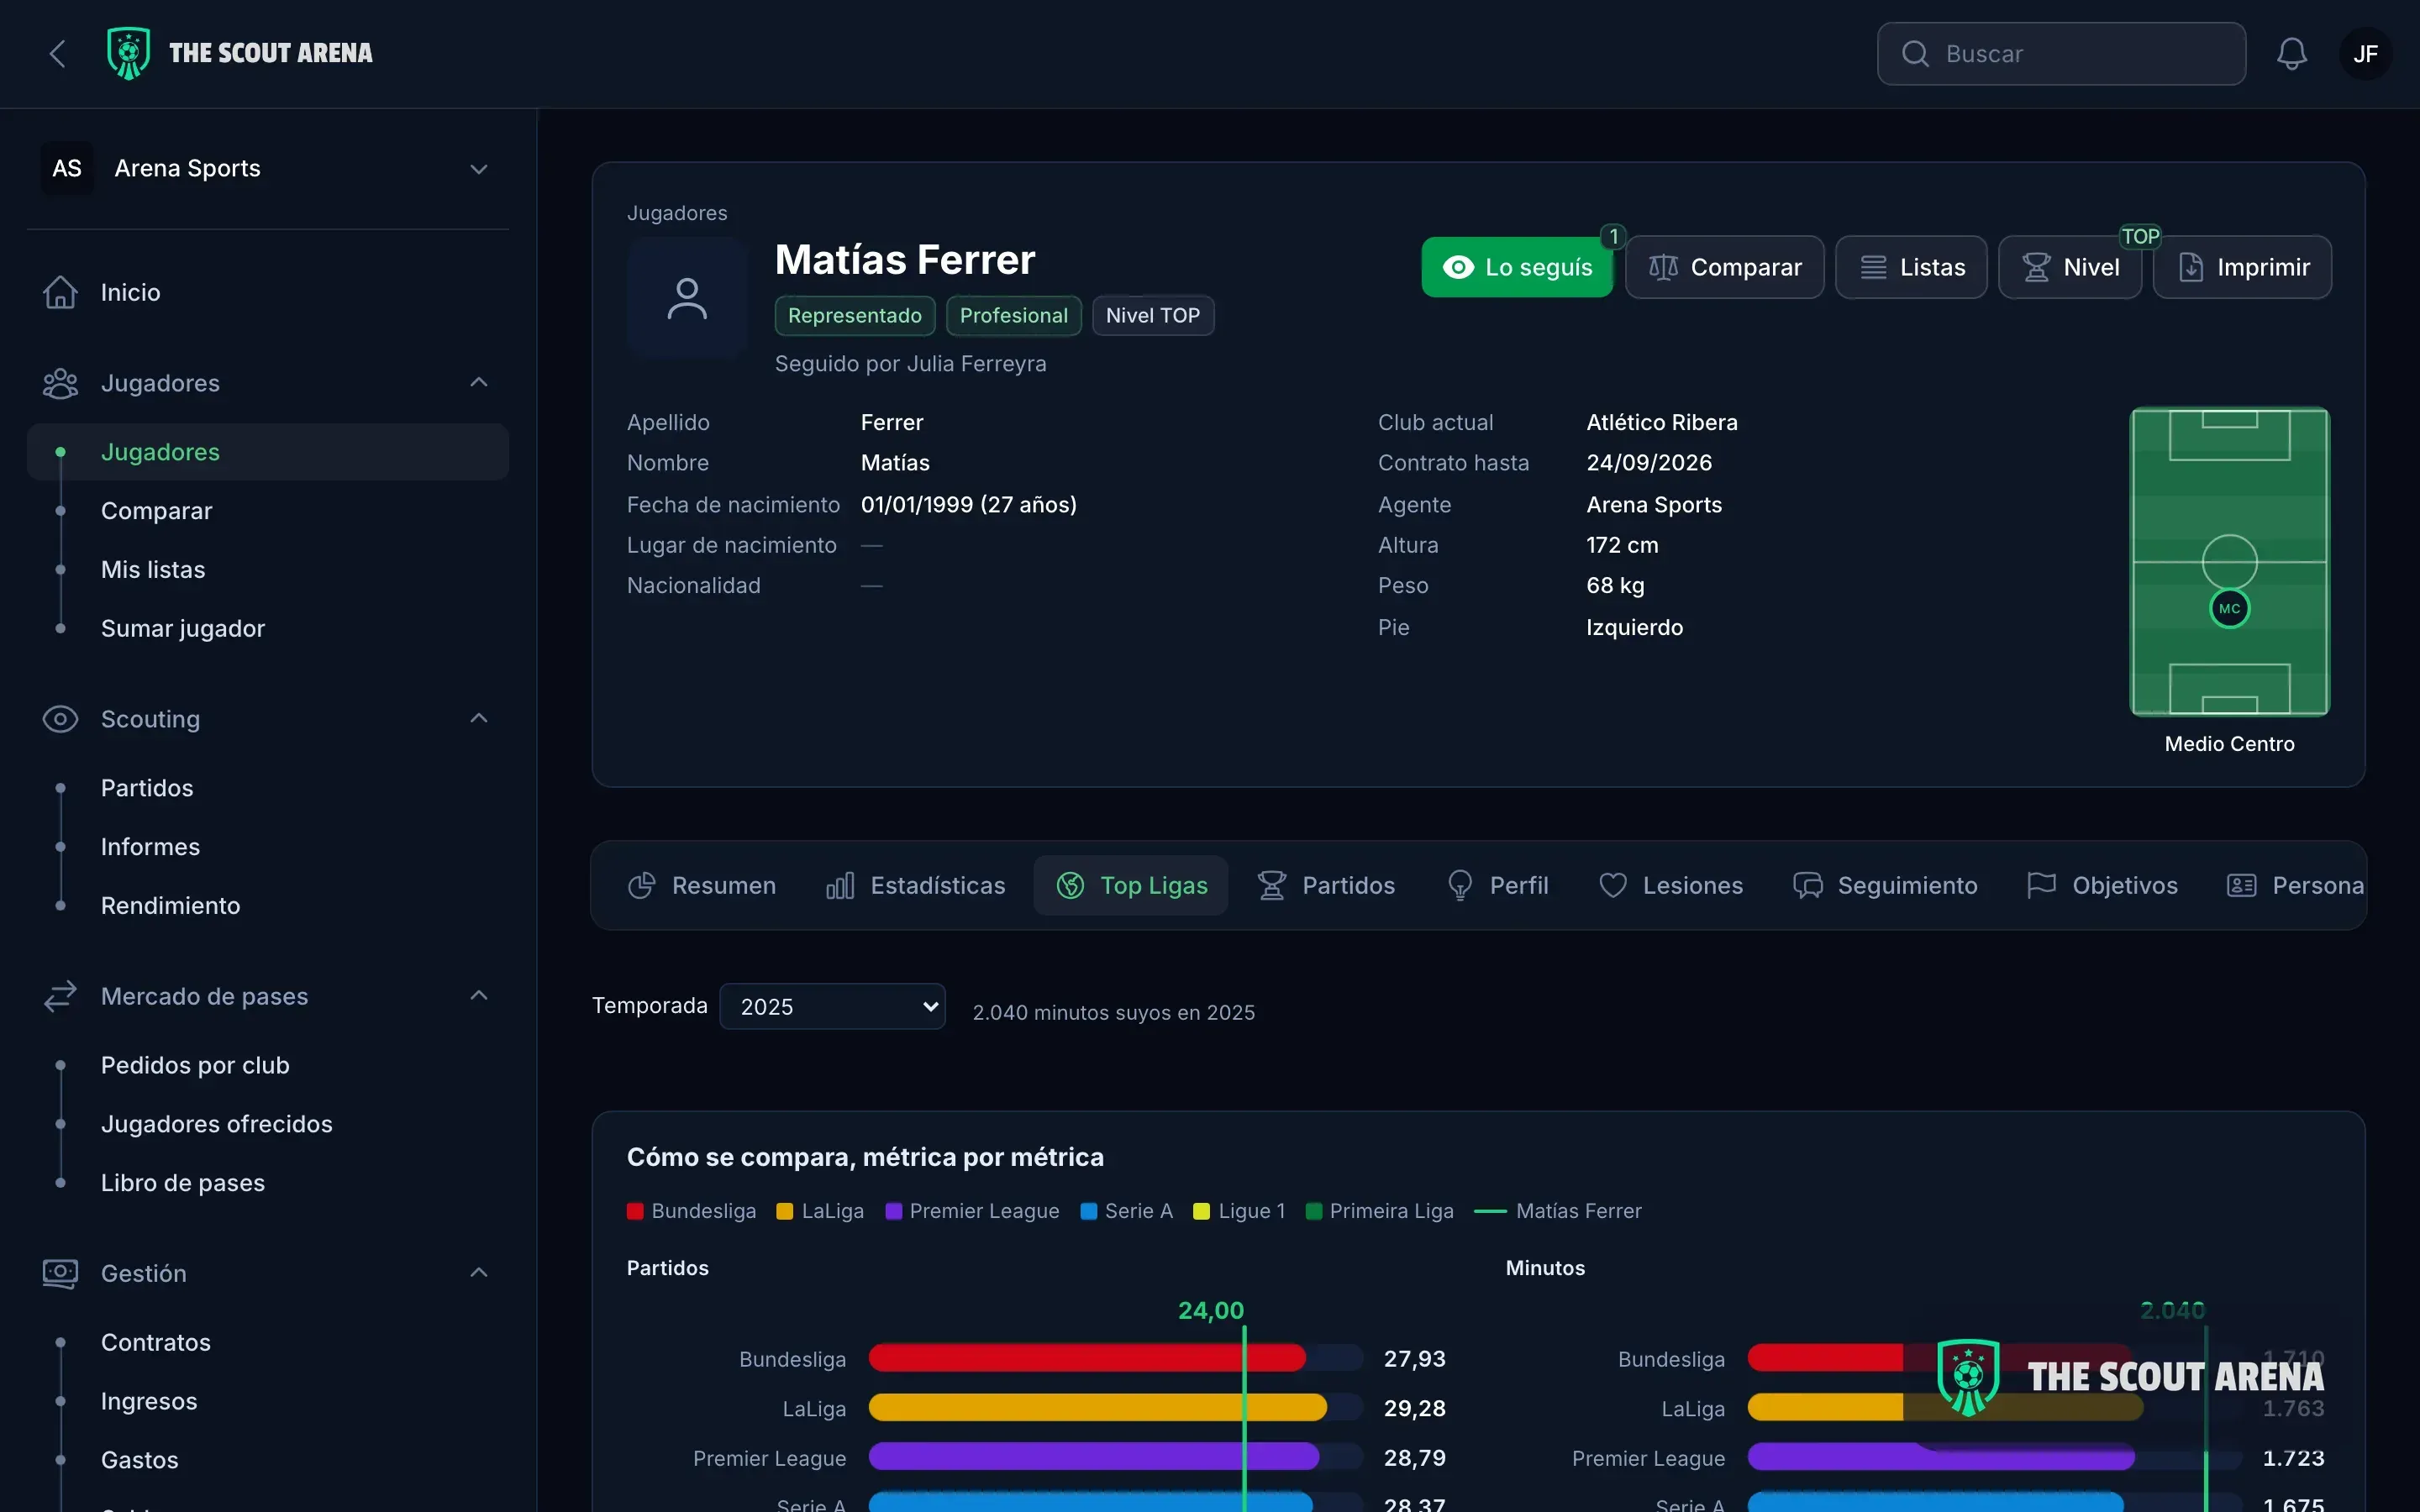
The number does not travel alone. Each match report is filled in with the attributes for the player’s position and lands on the same profile, so what the data says and what the scout saw are read together. If you work with Wyscout, your export goes into the same place and every block says which source it came from. What a working week looks like with that is on the page for scouts, and how to write up what you saw is in the scouting report guide.
In short
There is no official list of metrics by position, but there is a rule: look at what the role has to do. Goals conceded against expected for the goalkeeper; duels won and playing out for the centre-back; progression and times dribbled past for the full-back; moving forward and winning the ball back for the midfielder; danger created for the winger; non-penalty xG for the striker. Always per 90 minutes, against players in the same position, with minutes in view and without mixing sources. And defensive metrics with the team’s context beside them.
Article updated October 2026.
Sources
Consulted in October 2026:
- Hudl Statsbomb: New Statsbomb radars: 2023 update, 26 October 2023.
- Wyscout data glossary: defensive duel, aerial duel, progressive pass, possession-adjusted metrics (PAdj), xG and xCG and xA.
- FIFA Training Centre: FIFA to introduce Enhanced Football Intelligence at FIFA World Cup 2022, 11 November 2022.